spellbook.plot2D
Contents
spellbook.plot2D#
Lower-level functions for creating 2D / bivariate / correlation plots
The high-level functions for creating plots, which make use of the functions
in this module, can be found in plot.
Todo
Clean up and complete the documentation of spellbook.plot2D
- Functions:
|
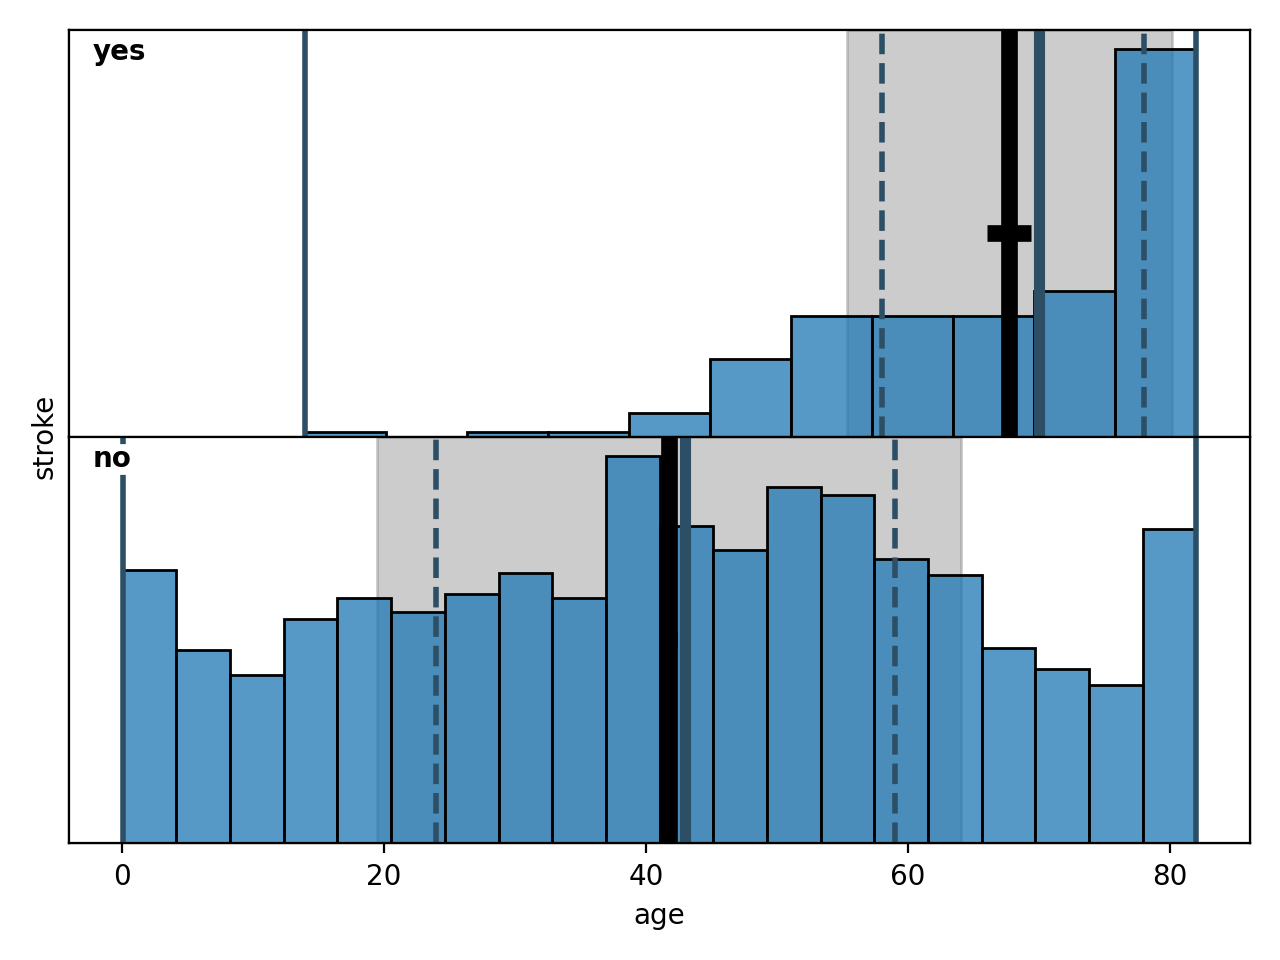
Multiple horizontal histograms above each other, showing the distribution of the continuous x-variable for each value of the categorical y-variable |
|
Plot the heatmap of a matrix |
|
Set the fontsize for numbers within the heatmap matrix |
|
|
|
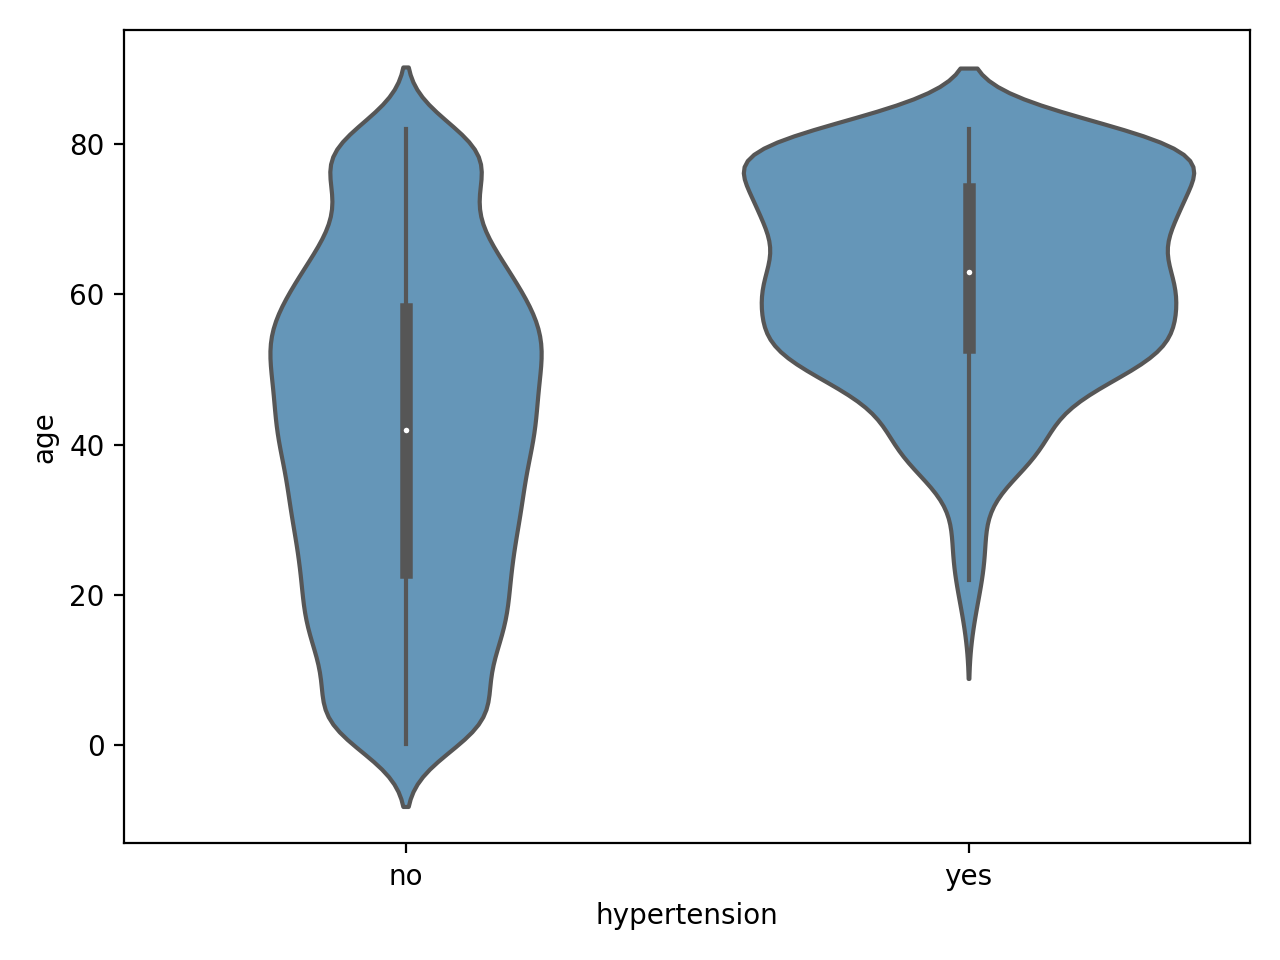
Multiple vertical violins beside each other, showing the distribution of the continuous y-variable for each value of the categorical x-variable |
Functions#
categorical_histogram#
heatmap#
- spellbook.plot2D.heatmap(data, fig, grid, gridindex, x='', y='', normalisation='count', crop=True, xlabels=None, ylabels=None, ylabels_horizontal=None, cmap='Blues', heatmap_args={})[source]#
Plot the heatmap of a matrix
The cells of the heatmap are colour-coded according to the values in the matrix. The matrix values are also printed in each cell, either in absolute numbers or in percentages normalised according to three different schemes, set with the normalisation parameter.
- Parameters
data (
numpy.ndarrayorpandas.DataFrame) – Thenumpy.ndarrayholding the matrix or thepandas.DataFramewhose correlations should be shownfig (
matplotlib.figure.Figure) – The figure on which to drawgrid (
matplotlib.gridspec.GridSpec) – The grid on the figure in which to drawgridindex (
int) – The index of the grid cell in which to drawx (
str) – Optional. The name of the variable on the x-axisy (
str) – Optional. The name of the variable on the y-axisnormalisation (
str) –Optional. How the values shown in the heatmap matrix should be normalised
count: the matrix values as they arenorm-all: the matrix is divided by the sum of all its entriesnorm-rowornorm-true: each row of the matrix is normalised (corresponding to the true labels on the y-axis when plotting a confusion matrix)norm-colornorm-pred: each column of the matrix is normalised (corresponding to the predicted labels on the y-axis when plotting a confusion matrix)
crop – Optional. When the heatmap is normalised along its rows/columns, the summary row/column on the top/right is not used and remains empty. When crop is set to
True, this unused row/column is dropped from the heatmap. Otherwise it is included and shows up as white space. This can be handy when it is desired to keep the cell positions the same for different heatmap plots with different normalisations.xlabels (
typing.Optional[typing.List[str]]) – Optional. The ticklabels for the categories/columns on the x-axisylabels (
typing.Optional[typing.List[str]]) – Optional. The ticklabels for the categories/rows on the y-axisylabels_horizontal (
typing.Optional[bool]) – Optional. If set toTrue, the ticklabels on the y-axis are oriented horizontally. Otherwise, their orientation is determined automatically by Matplotlibcmap (Matplotlib colourmap name or object, or list of colors) – Optional. The mapping between the values of the heatmap matrix and colours that should be used to represent them
heatmap_args (
dict) – Optional. Dictionary with the arguments and values to be passed toseaborn.heatmap()
See also
This function is usually called through the higher-level functions
which create the necessary underlying
matplotlib.figure.Figureandmatplotlib.gridspec.GridSpec.Todo
When a SUM column or row is shown, it would be nice to have the label of the same axis be centered on the classes only, and not on the union of the classes and the SUM column/row
heatmap_set_annotations_fontsize#
- spellbook.plot2D.heatmap_set_annotations_fontsize(ax, fontsize)[source]#
Set the fontsize for numbers within the heatmap matrix
- Parameters
ax (
matplotlib.axes.Axes) – The axes objectfontsize (
typing.Union[str,float]) – The fontsize to use
- Return type